Chapter Two
Of all the pieces of data that exist relative to attendance at performing arts events, none is more comprehensive than the National Endowment for the Arts' Survey of Public Participation in the Arts (SPPA). Begun in 1982, the SPPA has undergone some changes over the years, and has added categories as new types of arts (mainly digital) were created. Their core "benchmark" categories, however, have remain largely unchanged, and theatre is one of those core benchmarks. What I'd like to do here is give a rough overview of the information contained in the SPPA; I hope a deeper dive will follow once all the supporting data is released.
It's my belief that the data available in this report, which is usually released about every five years, is the most ignored data set among theatre practitioners and theorists today. The NEA just released its summary findings this past October detailing the years from 2017-2022, and as usual, the news is sobering.One look at this table might be all you need to grasp the issue:

The basic question asked of participants goes something like this: In the past year, have you attended at least one (insert art event)?. As the table makes clear, from 2017 to 2022, attendance at musical stage plays fell from 16.5% of respondents attending one musical, to 10.3%, a -6.2 percentage point drop, and a -38% rate of change. Non-musical stage plays went from 9.4% to 4.5%, a -4.9 percentage point drop, and a -52% rate of change. People continue to abandon theatre-going as a cultural activity.
Now, I realize these numbers are raw. They tell us attendance is dropping, but they do not tell us why. And we also know that this survey data takes in the worst of the pandemic years, when theatres across the country shut down. So the data might possibly be skewed a bit, and may not be representative of actual trends. But you can also look at these two timeline graphs, which show the percentages from 2002-2017:
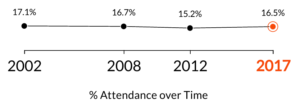
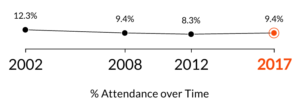
The numbers were always low, but with the 2022 data, the numbers have never been lower. 2017 was a banner year that seemed to stop the bleeding a little bit, but the trend has always been downward.
What to make of this broad data? If we think of theatre as a marketplace commodity, then the most obvious conclusion is that, for whatever reason, the market is drying up. If theatre is to be sustainable, and if we want artists to be able to create sustainable lifestyles through their art, then there must, first of all, be a market (and hopefully a growing one) for their product. But the data says, at this point in time, there is virtually no market, and whatever market is left is shrinking rapidly. If you don't have a market for your services/theatre, then the question of building a sustainable theatre endeavor is moot, or at the very best, foolhardy.
To put it plainly, theatre is dying because the market for theatre is dying. All the theatres that closed or reduced their seasons over the summer have clearly seen the writing on the wall. Theatres that have remained open have, on the whole, yet to recover to their pre-pandemic numbers. In a stagnant and shrinking market, it is clearly an immense challenge to think about creating a sustainable career in theatre, no matter how you go about doing it. Theatre is in an entropic spiral, and usually when that occurs, it's best to let the spiral take its course, much like the best option when fighting a forest fire is simply to let itself burn out.
I want to keep this post relatively short so as to lay a foundation for a closer look at the SPPA data. Probably after the Thanksgiving holiday I'll get another post written that will take a look at the demographic data contained in the report. In the meantime, if you'd like to get a jump on that post, you can find the 2023 SPPA Summary report on the NEA website. -Abercrombie